SKIP RITUAL
鎌倉沿岸部を研究対象とする個人の自主研究であり、自治体の公式サイト・運営事業ではない。2026年8月の入試提出資料を基準に、研究を3世代に分けて公開する。70,265人は最終人口設定、62,299人は25条件・242試行の感度分析、19,978人はTENDEN行動規則の別検証である。 This is an independent personal study of the Kamakura coastal area, not an official municipal website or municipal project. The August 2026 admissions record separates three datasets: 70,265 is the final population setting; 62,299 is the 25-condition, 242-run sensitivity study; and 19,978 is a separate TENDEN rule test. 这是以镰仓沿海地区为对象的个人独立研究,并非地方政府官方网站或运营项目。以2026年8月入试提交资料为准,研究分为三组:70,265人为最终人口设定;62,299人为25条件、242次敏感性分析;19,978人为TENDEN规则的独立验证。 가마쿠라 연안부를 대상으로 한 개인 자율 연구이며 지방자치단체의 공식 사이트나 운영 사업이 아니다. 2026년 8월 입시 제출 자료를 기준으로 세 데이터셋을 구분한다. 70,265명은 최종 인구 설정, 62,299명은 25조건·242회 민감도 분석, 19,978명은 별도의 TENDEN 규칙 검증이다. Este es un estudio personal independiente de la costa de Kamakura, no un sitio oficial ni un proyecto gestionado por el municipio. Según el expediente de admisión de agosto de 2026, se separan tres conjuntos: 70.265 es la población final; 62.299 corresponde al análisis de 25 condiciones y 242 ejecuciones; 19.978 es una prueba independiente de las reglas TENDEN. Il s'agit d'une étude personnelle indépendante de la zone côtière de Kamakura, et non d'un site officiel ou d'un projet municipal. Selon le dossier d'admission d'août 2026, trois jeux sont séparés : 70 265 est la population finale ; 62 299 concerne 25 conditions et 242 exécutions ; 19 978 est un test distinct des règles TENDEN.
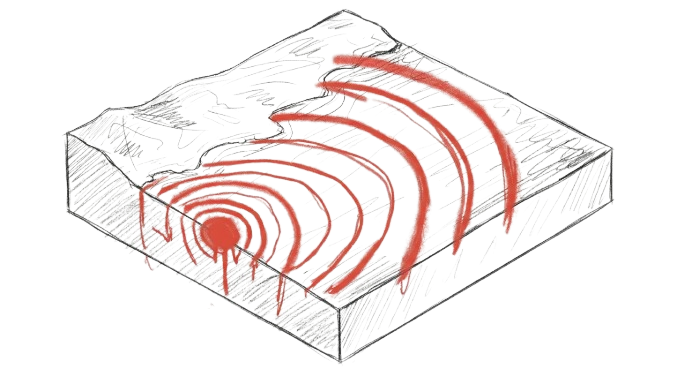
2011年3月11日——約19,000人が津波に飲まれた。
逃げられなかったのではない。逃げ方を知らなかった。
March 11, 2011 — nearly 19,000 lives lost to the tsunami.
Not because they couldn't run. Because they didn't know where to go.
2011年3月11日——约19,000人被海啸夺去生命。
不是跑不动。是不知道往哪里跑。
2011년 3월 11일 — 약 19,000명이 쓰나미에 휩쓸렸다.
못 뛴 게 아니라. 어디로 뛰어야 할지 몰랐던 것이다.
11 de marzo de 2011 — cerca de 19,000 vidas arrasadas por el tsunami.
No es que no pudieran correr. Es que no sabían adónde ir.
11 mars 2011 — près de 19 000 vies emportées par le tsunami.
Non par manque de jambes. Par manque de direction.
鎌倉に津波が来たとき、70,265人はどこへ向かうのか。 When a tsunami hits Kamakura — where do 70,265 people go? 当海啸袭来鎌仓——70,265人将何去何从? 쓰나미가 가마쿠라를 덮칠 때 — 70,265명은 어디로 향하는가? Cuando el tsunami golpea Kamakura — ¿a dónde van 70,265 personas? Quand le tsunami frappe Kamakura — où vont 70 265 personnes?
三方を山に囲まれた鎌倉では、観光客が地域住民と一緒に狭い古道へ殺到する。
このシミュレーションは、その混乱を数値で捉え、命を救う答えを探し続けている。
In Kamakura — boxed in by mountains — tourists and locals flood the same narrow ancient passes.
This simulation puts numbers to that chaos, searching for answers that save lives.
三面环山的镰仓,游客与本地居民涌向同样狭窄的古道。
这个模拟系统将混乱转化为数据,不断探寻能够拯救生命的答案。
삼면이 산으로 막힌 가마쿠라에서, 관광객과 주민이 같은 좁은 고갯길로 몰린다.
이 시뮬레이션은 그 혼란을 숫자로 포착하고, 생명을 구할 답을 찾는다.
En Kamakura, rodeada de montañas, turistas y vecinos se lanzan a los mismos pasos estrechos.
Esta simulación convierte ese caos en datos y busca respuestas que salvan vidas.
À Kamakura, encerclée de montagnes, touristes et habitants convergent vers les mêmes étroits passages.
Cette simulation transforme ce chaos en chiffres et cherche des réponses qui sauvent des vies.
※ 以下は70,265人の人口設定や62,299人・242試行の感度分析とは別系列。旧版と補助バッチはアーカイブで公開。 ※ This is separate from the 70,265 population setting and the 62,299-agent/242-run sensitivity study. Older and supplementary batches are in the archive.
TENDEN規則の適用率を上げると混雑ピークは17.5から9.5へ下がる傾向を示した。ただし密度は常に単調には下がらず、「一定の適用率を超えれば確実に安全」という閾値は2回の実行では再現できていない。 Peak congestion trended from 17.5 to 9.5 as model rule application rose. Density was not consistently monotonic, and two execution batches did not reproduce a reliable “safe above this rate” threshold.
モデルは現実の死亡率を直接予測せず、実際の利用者が理解・行動できるかも未検証である。結果は母集団・条件・試行数と一緒に読み、異なる世代の値を連結しない。 The model does not directly predict real-world mortality, and human comprehension and action remain untested. Read each result with its population, conditions, and run count; do not join values across generations.
静的な浸水域だけでなく「いつどこに津波が到達するか」を動的に計算。標高と傾斜で遡上速度が変化する Goto-Muhari 経験式と多始点ダイクストラ法を組み合わせ、全 2,135 ノードの到達時刻マップを一括生成する。 Beyond static inundation — calculates when the wave arrives at each point. Goto-Muhari empirical formula combined with multi-source Dijkstra generates arrival timestamps for all 2,135 inundated nodes.
              V(z,|∇z|) =

                Vbase / (

                 (1+α·z)(1+β·|∇z|)
              )
道路の面積に対して人が集中しすぎると限界密度(4.0人/㎡)に達し、Klüpfel モデルが速度を最小値まで落とす。由比ヶ浜沿岸のボトルネックで最大混雑指数 131.9 を観測。これは限界密度の33倍に相当する。 When crowd density exceeds 4.0 ppl/m², the Klüpfel model collapses walking speed to its floor value. Peak congestion index of 131.9 observed at the Yuigahama coastal bottleneck — 33× the limit density.
半径20m内の走行エージェント数に応じて危機感を加算する明示的な行動規則を実装し、同調行動の連鎖を比較した。個人間の引力・斥力を解くSocial Force Modelそのものではない。 An explicit rule adds crisis level according to runners within 20m and compares chained conformity. It is not a full attraction/repulsion Social Force Model.
Tobler の連続歩行速度関数 v = exp(-3.5|S+0.05|+0.175) を採用。急勾配の切通しでは高齢者・児童の速度低下が致命的になる。v1.0 のステップ関数から連続補正へ精緻化。 Tobler's continuous walking speed function v = exp(-3.5|S+0.05|+0.175). Steep passes become fatal for elderly and children. Upgraded from v1.0's step function to continuous correction.